
The eIDAS Node Monitor watches the current eIDAS test and production nodes of the Member states with regard to their availability. This monitor aims to support the future integration of the notified eIDs and the interoperability between the different eID schemes. The monitor checks for the availability of the eIDAS network nodes, including the eIDAS Services and eIDAS Connectors. It also performs a check of the validity period for the certificate corresponding to the signature of the SAML metadata file of each service, in order to get an insight on the frequency with which these nodes are being maintained. Finally, the monitor allows for generating performance data for reporting.
Links
1. Introduction
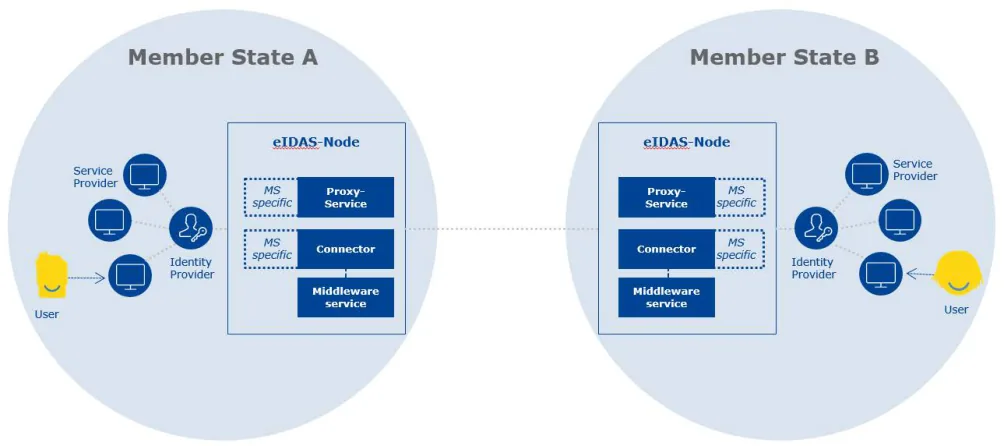
The eIDAS network ensures interoperability of the notified eID schemes and provides cross-border authentication according to the eIDAS Regulation [1]. In this section, we provide an overview on the eIDAS network architecture, its main stakeholders, and the communication relationships between its entities.
According the eIDAS Technical Specifications [2], eIDAS Nodes, i.e. the operational entities of this network, can have the roles of either eIDAS Connector or eIDAS Service, depending on whether it is the node that requests cross-border authentication (Connector), or provides cross-border authentication (Service). Member States operating these nodes can take the roles of (i)Sending MS; the MS whose eID scheme is used in the cross-border authentication process, or (ii)Receiving MS, the MS of the Relying Party that requests the authentication and receives authenticated data sent by the Sending MS. Furthermore, a Member State can implement an eIDAS Service as eIDAS Proxy Service or eIDAS Middleware Service. The eIDAS Proxy Server is operated by the Sending MS, whereas the Middleware Service is provided from the Sending MS but operated by the Receiving MS.
An overview of the eIDAS Network can be seen in Figure 1.
The main stakeholders of the eIDAS network are persons or citizens, Relying Parties or Identity Providers, and operators of the network components, i.e. eIDAS Nodes. Citizens and Relying Parties require from the operators of eIDAS Nodes the availability of the eIDAS network. To fulfil these requirements, and to provide accountability, a constant monitoring of the availability of the eIDAS nodes is needed. This also benefits eIDAS node implementers, as they are able to see the status of the eIDAS node implementation and operation in other countries.
An overview of the current status of the eIDAS node implementation and operation can be found under: https://ec.europa.eu/cefdigital/wiki/display/CEFDIGITAL/Country+Overview+-+eID
2. Implementation
The following section provides an overview of the eIDAS Monitor implementation.
1.1. Deployed Software
The network monitoring tool Icinga 2 [4] is used to monitor the eIDAS nodes. This tool is hosted on a Linux server from which the eIDAS nodes are periodically checked. In addition to the real-time status of the nodes, the eIDAS Monitor is able to show a graphical overview of the previous states of the nodes. The Icinga PNP [5] plug-in is used to implement this feature. In addition, NagVis [6] is utilized for a graphical representation of the real-time status of the nodes.
1.2. Structure of the Configuration Files
The nodes to be monitored are defined in a configuration file which is located in the configuration folder of Icinga 2 (/etc/icinga2/zones.d/master/). Icinga 2 differentiates between different types of objects to be monitored. For the eIDAS Monitor, the so-called hosts and services are relevant. Generally, hosts are remote machines defined by an IP address or domain name. Each of the services is offered by a specific host. These can be a variety of services, such as POP, SMTP, or HTTP(S). However, these services are not to be confused with the eIDAS services. For the remainder of this document, services as defined by Icinga are called Icinga-Services for better distinction.
   object Host "GR_test" {
   import "generic-host"
   address = "pre.eidas.gov.gr"
   check_command="dummy"
   object Service "Service" {
   check_command = "http"
   vars.http_vhost = "pre.eidas.gov.gr"
   vars.http_uri = "/EidasNode/ServiceMetadata"
   vars.http_string =
   "entityID=\"https://pre.eidas.gov.gr/EidasNode/ServiceMetadata\""
   vars.http_ssl = true
   object Service "Connector" {
   check_command = "http"
   vars.http_vhost = "pre.eidas.gov.gr"
   vars.http_uri = "/EidasNode/ConnectorMetadata"
   vars.http_string =
   "entityID=\"https://pre.eidas.gov.gr/EidasNode/ConnectorMetadata\""
   vars.http_ssl = true
   object Service "Service_Certificate" {
   check_command = "check_eidas_cert"
   vars.xml_url = "https://pre.eidas.gov.gr/EidasNode/ServiceMetadata"
Listing 1 Configuration Example For the eIDAS Monitor, the domain names of the eIDAS Services and Connectors are used to define the host object. To better illustrate the structure, Listing 1 shows part of the configuration of a node. In the example, the domain name “pre.eidas.gov.gr” is used for the definition of the host object named “GR_test”. Since the domain name is the same for both the eIDAS Service and the Connector in our example, the same host object can be used for the Service and the Connector. If this is not the case, a separate host must be created for the Service and the Connector. The defined hosts serve as the parent for the Icinga-Services. In our example, these are defined by the name Service and Connector. For each of these Icinga-Services a check is defined. These are explained in more detail in the following chapter.
1.3. Checks
The eIDAS Monitor checks the URLs defined in the Icinga-Services for their availability at regular intervals. The URLs are constructed by concatenating the vars.http_vhost and the vars.http_uri parameter in the configuration file. The check is executed every five minutes. The called URLs point to the metadata provided by the nodes. The monitor does not just check whether the metadata exists or not, but also if the entityURL is part of the response and points to the current URL. This check is performed on both the Service and the Connector. The checks are defined in the example configuration in Listing 1 by the element vars.http_string within the definition of the Icinga-Services. In addition, for the eIDAS Services the certificate belonging to the signature is parsed and checked to see if it has not yet expired. A separate Icinga-Service is defined for this check, since only one check can be defined per Icinga-Service. In the example in Listing 1, this Icinga-Service is called Service_Certificate.
By default, Icinga 2 checks every defined host by running a ping command periodically. However, this check has been disabled for the eIDAS Monitor because most eIDAS nodes do not respond to this command. However, for the eIDAS system, it is generally irrelevant whether only the Icinga-Service is not running or the entire host cannot be reached. Therefore, disabling this check does not limit the usefulness of the eIDAS Monitor.
To check the entityURL, the monitor uses a checking routine built into Icinga 2. However, there is no default command to validate a certificate. Therefore, we have developed an Icinga 2 plugin, which is based on the check_xml plugin built by the community. Our plugin traverses the XML tree of the metadata file until it reaches the certificate of the signature. It then extracts the certificate. As the certificate is base64 encoded the plugin first decodes the certificate and then uses OpenSSL to obtain the end date of the validity period. The end date is then checked against the current date. If the end date is in the past, the plugin emits a warning, as this is a sign that the eIDAS node may be unmaintained.
3. Results
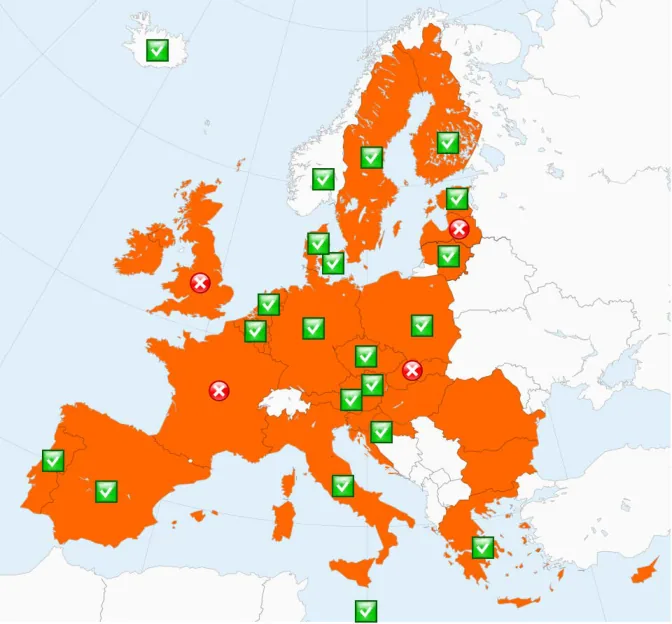
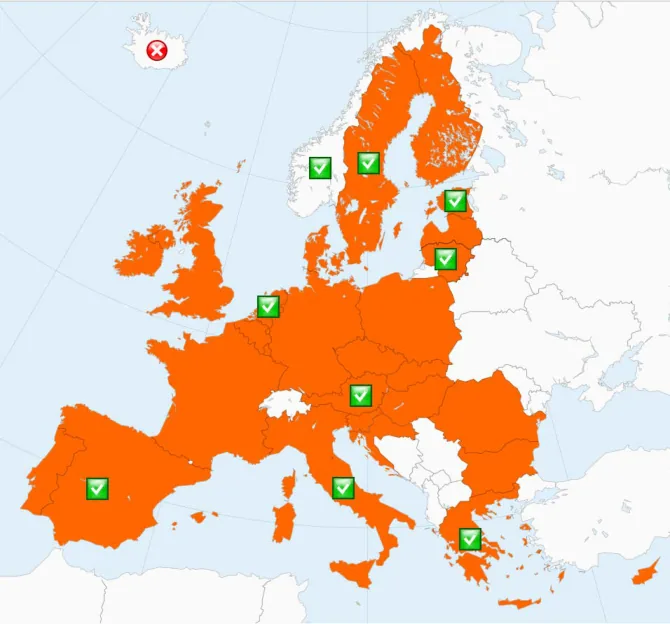
In this section, we provide a short overview of the eIDAS Node Monitor [7]. The graphical representation is split up into two different maps: The Test Nodes Map and the Production Nodes Map. Example screenshots of these two maps can be found in Figure 2 and Figure 3.
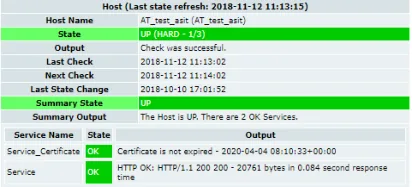
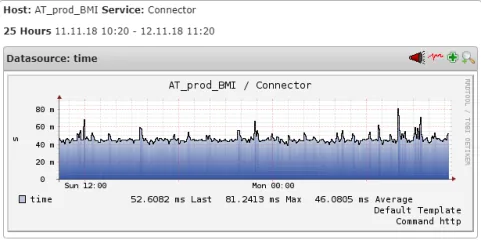
accessed. An example for this can be found in Figure 4. The detail view shows extensive information about the Icinga-Services defined for the host, including the state and the output of the last check. Furthermore, the detail view shows the date of the last state change, the previous and the next scheduled check.
4. References
[1] „eIDAS Interoperability Architecture,“ [Online]. Available:
https://joinup.ec.europa.eu/sites/default/files/document/2015-11/eidas_interoperability_architecture_v1.00.pdf. [Accessed 12 11 2018].
[2] „eIDAS Technical Specification 1.1,“ [Online]. Available:
https://ec.europa.eu/cefdigital/wiki/display/CEFDIGITAL/2016/12/16/eIDAS+Technical+Specifi cations+v.+1.1. [Accessed 12 11 2018].
[3] „How does it work - eIDAS Solution,“ [Online]. Available:
https://ec.europa.eu/cefdigital/wiki/display/CEFDIGITAL/How+does+it+work++eIDAS+solution. [Accessed 12 11 2018].
[4] „Icinga 2,“ [Online]. Available: https://icinga.com/products/icinga-2/. [Accessed 12 11 2018].
[5] „PNP4Nagios,“ [Online]. Available: https://www.pnp4nagios.org/. [Accessed 12 11 2018].
[6] „Nagvis,“ [Online]. Available: http://www.nagvis.org/. [Accessed 12 11 2018].
[7] „eIDAS Monitor GUI,“ [Online]. Available: https://eidasmonitor.a-sit.at/nagvis/. [Accessed 12 11 2018].